
Categories aligned to Analytics Dome
Switch between the core workflows to see how the module supports each stage.
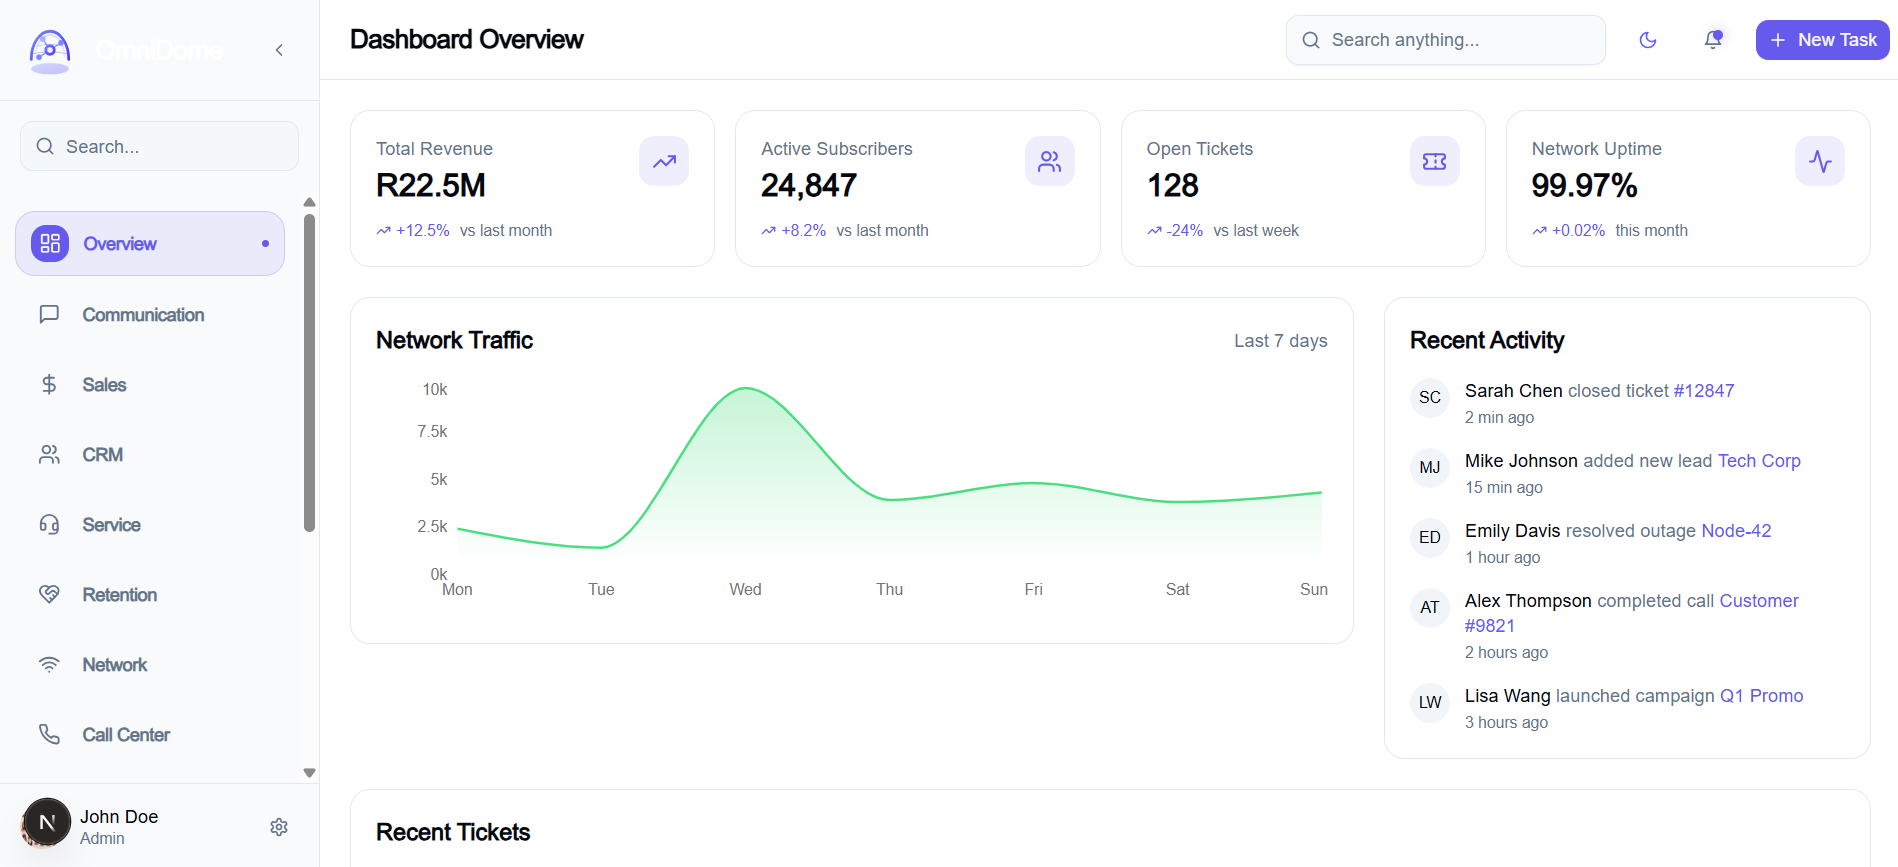
Still infographics that highlight what matters
Alternate layouts so each product page feels distinct while staying on brand.
Executive rollups
See KPIs across every module in one dashboard.
Insight stream
Surface anomalies and opportunities in real time.
Cross-module trends
Track signals that drive revenue and retention.
Everything you need in Analytics Dome
Powerful features designed specifically for ISP operations.
Executive Dashboards
Unified KPI dashboards with automated rollups across every team.
Insight Automation
AI-driven summaries and alerts that highlight risks and opportunities.
Self-Serve Analytics
Build reports without engineering help and share them instantly.
Leadership reporting standardized in one analytics layer
Teams consolidated metrics into a single dashboard for faster decisions.

Challenge
Executives spent days pulling data from multiple systems.
Approach
Unified analytics with automated KPI snapshots.
Execution Path
Week 1 - KPI definitions
Aligned metrics across teams.
Week 2 - Data pipelines
Connected operational sources.
Week 3 - Insight automation
Rolled out alerts and summaries.
Outcomes
Cross-module executive dashboards.
Automated KPI snapshots.
AI summaries and alerts.
Self-serve reporting.
"Decisions happen in hours, not weeks."